Why is “learning loss” so trendy?
Everywhere you look these days, you see stories focused on the woeful state of public education in the U.S. From stories about pandemic learning loss questioning whether we’ll ever recover to stories purporting that education is “bleak.” But is this an accurate picture of what’s happening in U.S. education? And what do such claims mean for education?
Let’s use the recent release of data from the National Assessment of Educational Progress, popularly known as the NAEP, to examine this issue.
What do the data say?
Reports that claim the decline of U.S. education always include data that show this decline in stark graphics—line plots, pie charts, and bar graphs that shock the senses. But what mathematics teachers know is that data can be accurate and can be selected to tell a story. Both can be true. Let’s take a look at this graph of 4th grade NAEP mathematics scores.
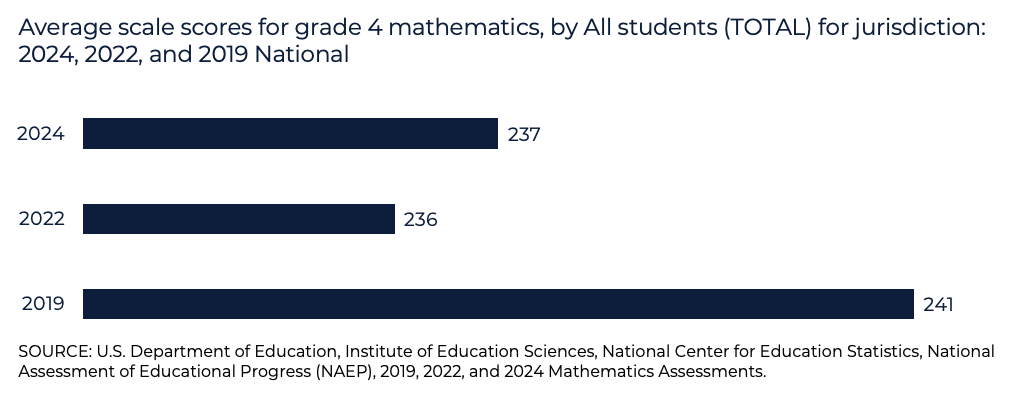
Based on a glance at this graph, headlines like “US children fall further behind in reading, make little improvement in math on national exam,” “Reading, math continue slide in 2024 NAEP results,” and “Two decades of progress nearly gone: national math, reading scores hit historic lows” may make sense. We see that in 2019 the scores were higher than in 2022 and 2024, which are about the same. It appears that we’ve lost ground and we’re staying there. However, when we examine things more closely, we see that between 2019 and 2024 the average scale score only dropped by 4 points on a 500-point scale. This is a relatively small fluctuation in scores, not a catastrophe. As our high school math teachers would tell us, the data selections and graph scales are emphasizing that difference, making it appear extreme in order to support a story. Let’s take another look at the data, this time looking across decades.
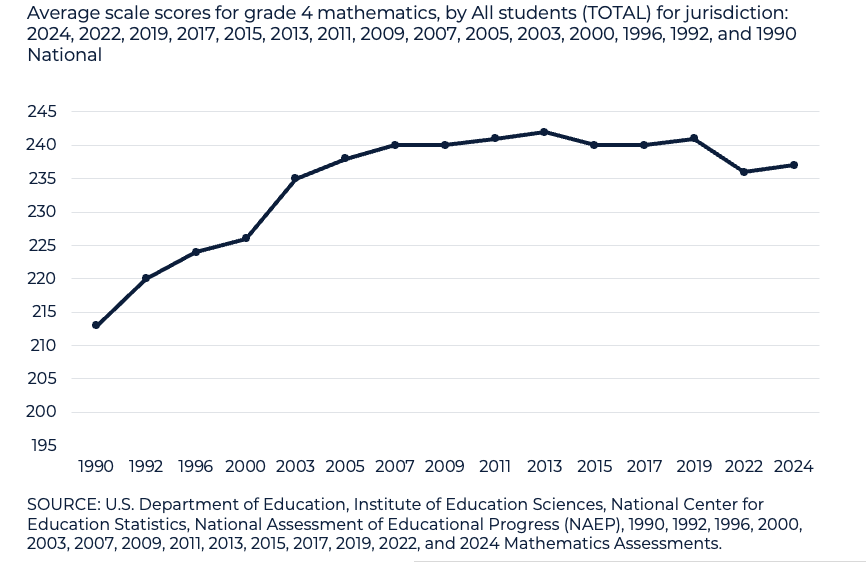
Now we see a more complete story. Since 1990, when I was finishing elementary school, the average scale score has risen 24 points. By choosing a more complete data set, we see that in the grand scheme of things, 4th grade performance on the NAEP has increased.
Engaging with data critically
So, what does this mean? Are things steadily improving or are things bleak? Well, our math teachers would remind us that data are just that—pieces of information gathered through measurement. Each of us has to interpret those data in order for them to be useful. Headlines and carefully crafted graphs are other peoples’ interpretations of those data. But one’s interpretation always depends upon the questions you ask yourself about those data. And there are two questions that are critical.
First, what does a gain or loss of 1 point mean practically? The answer to this question is fairly straight forward: given the sample size, a change of 1 point in performance may be the result of a single question being answered either correctly or incorrectly (see the free download of NCTM’s Mathematics Education in the United States 2020: A Capsule Summary Fact Book for more data and data interpretation on mathematics education in the U.S.). In other words, small changes in performance can mean very little practically.
The second question is one for all of us. Is a change in points what we should really be worrying about? Each of these headlines and each of these representations requires us to be critical consumers, remembering that data can obscure the true issues at stake. In this case the focus on points gained/lost obscures the fact that one of the likely reasons that the scores have only grown from just below the “basic” cut score to closer to the “proficient” cut score is because students haven’t been provided with opportunities to engage regularly with the doing of mathematics. By “doing” mathematics, I mean opportunities beyond memorizing facts and procedures—opportunities to problem-solve, revise/refine/justify mathematical thinking, communicate mathematical ideas, and really use mathematics. These are all things that are named prominently in state standards across the country. Districts, leaders, and teachers are told that these opportunities are needed, but as every good teacher knows, telling isn’t the same as teaching. And while policy may be necessary for change and growth, it isn’t sufficient.
So, what can we do?
To be clear, public education is not failing all of our students and in need of a complete overhaul because of NAEP performance. The kids, as they say, are alright. More students are taking mathematics beyond Algebra I than ever before. But that doesn’t mean that we are serving them to the best of our ability or that there aren’t changes to be made.
If we want to change the opportunities our students have in mathematics, we need to invest in supporting mathematics teachers—the very people who can provide those enriching opportunities for children listed above. This is how we made our initial gains on the NAEP. The nation invested in education research and the development of research-based curriculum resources and standards. Now we need to invest in supporting teachers’ learning.
Our current systems of teacher preparation and hodge-podge professional learning, often generic in nature or left up to individuals without expertise in mathematics teaching and learning, are not sufficient. At TeachingWorks, we are committed to building and advancing systems of valuable professional learning that support the continual development of teachers’ mathematical knowledge for teaching, refinement of teaching practice, and awareness of how their work as teachers impacts students’ daily and lifelong experiences as learners and members of our global community. We work with our partners across the country to ensure that their mathematics teacher preparation is focused on the knowledge, skills, and dispositions necessary for supporting the students in our classrooms. We create time, space, and support for mathematics teacher reflection and learning. Join us in the call to support all teachers—from preservice teachers to those with a lifetime of experience.